
Applying CNNs to EEG data from CHB-MIT to predict seizure
General ·Using Convolutional neural networks (CNNs), a deep learning algorithm, for classifying EEG data.
The objective of this university project was to replicate the results obtained in the following paper: Truong, Nhan Duy, et al. “Convolutional neural networks for seizure prediction using intracranial and scalp electroencephalogram.” Neural Networks 105 (2018): 104-111.. The main idea behind this project is to predict seizure using a CNN model trained on spectrograms obtained from the data of the CHB-MIT Scalp EEG Database.
NOTE: The repository is not the official repository used by the creators of the paper above mentioned. There is no connection, we only followed their procedure to replicate the results.
Procedure
The project is divided into three main part, creation of the data for the CNN, training and evaluation of the CNN, search for the best threshold for each patient.
Before explaining the procedure, some notations need to be explained. The EEG data will be split into three categories:
- Seizure data are the one corresponding to the seconds where the seizure is happening;
- Preictal data are 30 minutes of data recorded between 35 minutes before the seizure happen and 5 minutes before the seizure happens;
- Interictal dat are the data recorded 4 hours before a seizure and/or 4 hours after the verification of a seizure.
The objective is to create a CNN that can recognize if a window of 30 seconds of data is a Preictal or Interictal data and so if the first case it’s verified, there is time for the patient to act for prevention.
Creation of the spectrograms
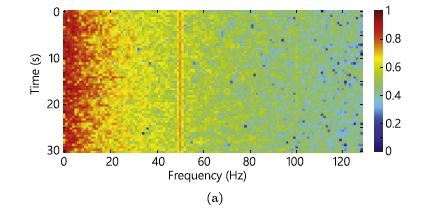
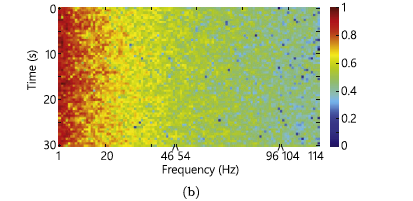
From the dataset, only interictal and preictal data are used from patients that had at least 10 seizures. To convert the wave signals obtained by EEG to something valuable for a CNN, the STFT(short-time Fourier transform) is used. The Fourier transformation was applied to windows of 30 seconds of data producing spectrograms. The EEG data present some noise and so a filter was applied to remove the frequencies in the ranges 57-63 Hz and 117-123 Hz. The following images are shown as an example of data with noise and cleaned data. They do not come from the analyzed dataset. In the images, the noises are in the frequency of 50 Hz and 100 Hz.
Balancing the dataset
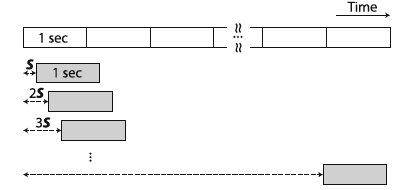
Since the dataset obtained by selecting only Interictal and Preictal data is not balanced, we created synthetic data to increase the amount of Preictal data. That was achieved by overlapping the windows used to create the spectrograms, so instead of moving the window of the size of the window, we move it by a factor S evaluated to obtain a balanced dataset.
Creating the CNN model
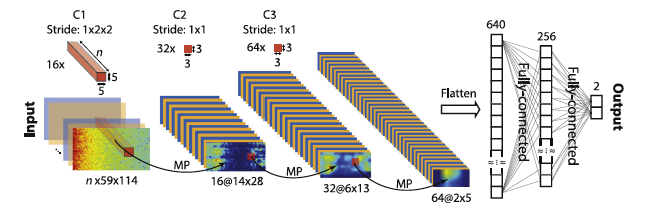
Finally, the CNN model is created using Keras 2.0. The model used has three convolutional blocks (the size of the different layers are shown in the following figure) and two fully connected layers. The final output is obtained using a softmax function.
To avoid overfitting, 75% of the data were used for training and validating and 25% for testing. A leave-one-out cross-validation approach was used so for every patient the model was executed N time as the number of seizure leaving each time a pre-ictal out for testing.
Postprocessing
Here is important to isolate the false positive during the interictal periods. A filter called k-of-n is used: the alarm is activated (to notify the arriving of a seizure) if and only if k of n predictions are positive. In our case, we use k=8 and n=10. That means that if in the last 300 seconds, at least 240 are considered preictal signals, the alarm is activated.
System evaluation
To evaluate the system two indexes are used:
-
Sensitivity : the number of correctly predicted seizure divided by the total number of crisis;
-
False Positive Rate (FPR) : number of false alarm per hour.
For defining a corrected prediction, two concepts need to be introduced:
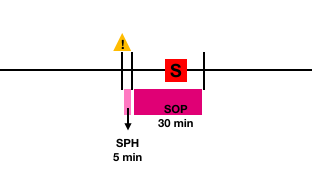
- Seizure Occurrence Period (SOP) : interval of time in which it’s expected the seizure to happen. In this case, it is set to 30 minutes.
- Seizure Prediction Horizon (SPH) : interval of time between the alarm and the beginning of the SOP. In this project, it is set to 5 minutes.
A prediction is correct if the crisis comes after the SPH and inside the SOP. A false alarm is when the system sends an alarm but no seizure occurs during the SOP interval.
Changing in the dataset
Studying the dataset we found some incoherences with the hour of interictal and preictal presented in the original paper. So we choose only the patient without inconsistencies. We select only Patient 1, 2, 5, 19, 21 and 23. For the 19 we didn’t consider the first seizure because to near to the start of the recording. Moreover, we didn’t consider part of the data with less than 22 channels. That happens only for a couple of patients and for short periods.
Results and comments
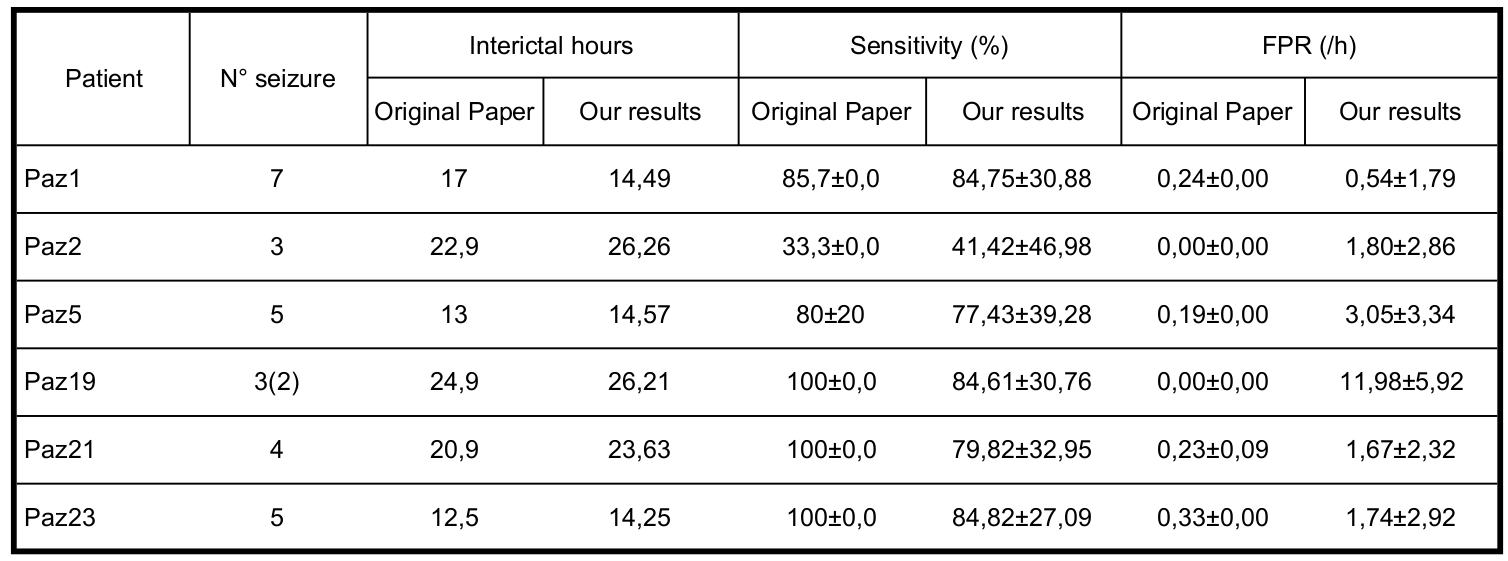
In the following table, the final results are expressed. It’s difficult to make a fair comparison since the interictal hours considered are not the same. We split the data following the instruction of the paper so we didn’t understand why we obtained a different amount of data. Anyway, the results are similar to the ones obtained by the paper.
Conclusion
More detailed information on how to use the repository is in the README.md of the repository of the project https://github.com/SMorettini/CNNs-on-CHB-MIT. Additional comment and result analysis can be found in presentazione and relazione. The two files are respectively the presentation and the relation of the group project in the Italian language.
For any clarification and question feel free to contact me using the contact form, opening a new issue in the repository of the project or by leaving a comment under this post.