
Creating an animation of a Dashboard in Blender
General ·Making a video of an animated dashboard seems simple but there is no free, automatic and customizable way available in the web at the moment I wrote this article.
For a university course, with my team, I had to do a demo of a product. We were asked to show a 3D animation of the product, its internal states and the data acquired by it. So I created this small project to realize a video of a dashboard using some data. The project is very general and can be used in very different cases. Here there is an animation of what is possible to realize with the project. It’s only an example and so the layout is very minimal and not adjusted.
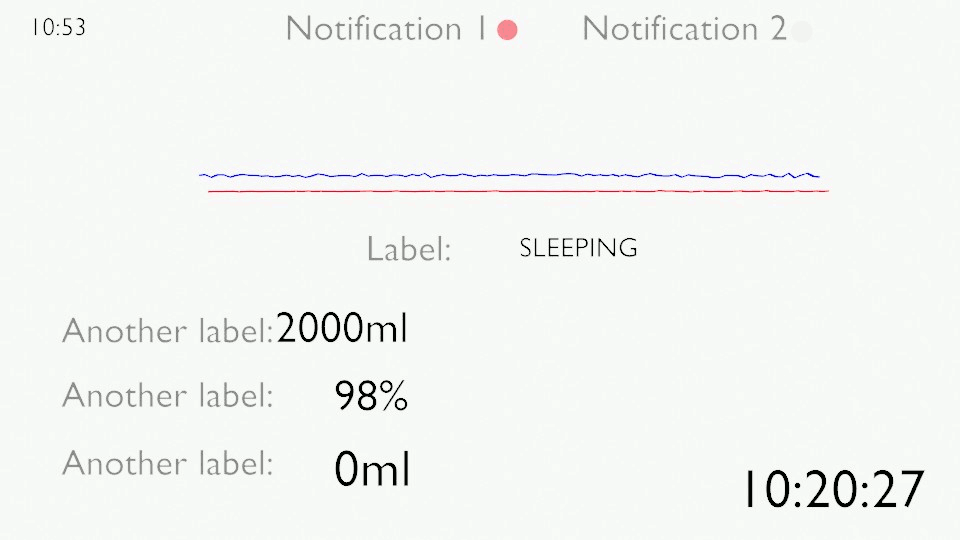
From the animation is possible to notice the line chart animation, the text that change over time and the little circle that become red that I call notifications.
How it works
The project is realized using Blender and some scripts in Python. To use it you should have some basic knowledge of them. The script took as input a CSV file containing all the data you want to animate and they can be of three different types:
- Numerical data for animated line chart;
- Text that you want to change during the animation by imposing a value for each frame;
- Boolean to show and hide some object to obtain notification effect.
The script will then load the data from the CSV and will create a line chart animation by setting the animation frame of a line object using key-frames. For the text animation and notification effect, it’s not possible to set key-frames because the text property and the visibility are not key-frameable. So the script will create some handlers that change in runtime these properties of the objects. The handlers are not saved in the Blender file so every time you open your project you have to run the script again. I suggest disabling the line chart animation part of the script after the first execution since one execution is enough because the key-frame will be saved with the file.
The script is made only for the animation part. Regard the layout part, you have to make manually by editing the material inside Blender, change the background and everything else like in a normal Blender file. The only thing that it’s important is to give the name at the object in the correct way as explained in the README.md otherwise, the script will fail to animate them.
More detailed information on how to use the code is in the README.md of the repository of the project https://github.com/SMorettini/AutomaticVideoDashboard_Blender. The project contains also a working example that you can download and execute.
Conclusion
If you need to do static plot in Blender I suggest you this other plugin https://github.com/Griperis/BlenderDataVis from where I took inspiration to realize some part of my script.
For any clarification feel free to contact me using the contact form, opening a new issue in the repository of the project or by commenting below.